In the context of machine learning, slope of best fit refers to finding the optimal line that best fits a given set of data points. This line is determined by minimizing the difference between the predicted values and the actual data values. This line may pass through some of the points, none of the points, or all of the points.
The slope of best fit is commonly used in linear regression, a basic machine learning algorithm.To calculate a given line of best fit, we need to be able to know this mathematical formula:
The equation for the line is: y = MX + B. Where X represents the x-axis values, while M and B is the slope and the distance from the y-axis, respectively. Our first step is to calculate the slope M:
M = ((average of X values * average of Y values) – (average of X values * Y values)) / ((average of X values)^2 – average of (X values^2))
In python:
    m = (
        ((mean(X) * mean(Y)) - mean(X*Y)) /
        ((mean(X)**2)) - mean(X**2)
    )
Next we need to find B value:
B = average of Y values – M*average of X values
In python:
b = mean(Y) - m*mean(X)
In linear-regression we worked on the data set taxis, defining the value of X as follows:
X = np.array(df.drop(columns=['pickup', 'payment', 'price'],
                     axis=1))
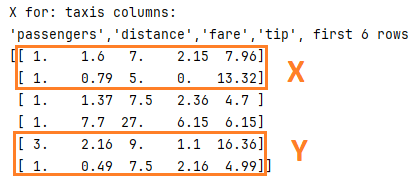
We will use this in this exercise to define our X and Y:
X = np.array([ 1.0, 1.6, 7.0, 2.15, 7.96,
                1.0, 0.79, 5.0, 0.0, 13.32],
             dtype = np.float64)
Y = np.array([3.0, 2.16, 9.0, 1.1, 16.36,
               1.0, 0.49, 7.5, 2.16, 4.99],
             dtype = np.float64)
Full code:
from statistics import mean
import numpy as np
import matplotlib.pyplot as plt
from matplotlib import style

style.use('dark_background')

X = np.array([ 1.0, 1.6, 7.0, 2.15, 7.96,
                1.0, 0.79, 5.0, 0.0, 13.32],
             dtype = np.float64)
Y = np.array([3.0, 2.16, 9.0, 1.1, 16.36,
               1.0, 0.49, 7.5, 2.16, 4.99],
             dtype = np.float64)

def Fit_Slope(X,Y):
    m = (
        ((mean(X) * mean(Y)) - mean(X*Y)) /
        ((mean(X)**2)) - mean(X**2)
    )
    b = mean(Y) - m*mean(X)
    return m,b

m,b = Fit_Slope(X, Y)

regression_line = [(m*x)+b for x in X]

plt.scatter(X,Y)
plt.plot(X, regression_line)
plt.show()
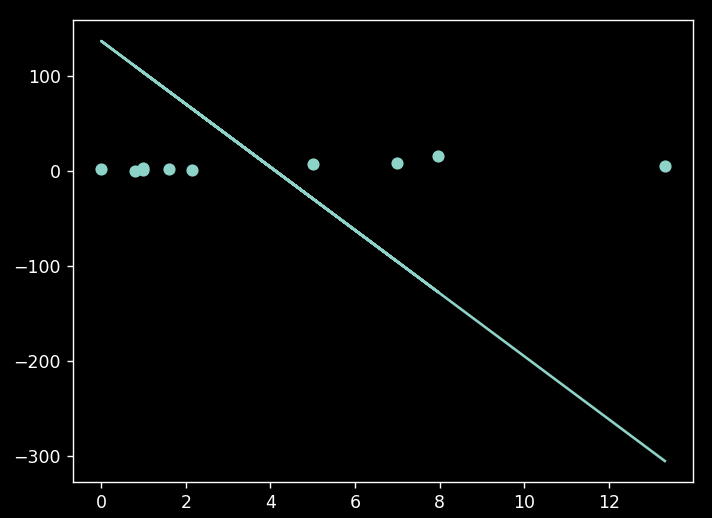
Result:
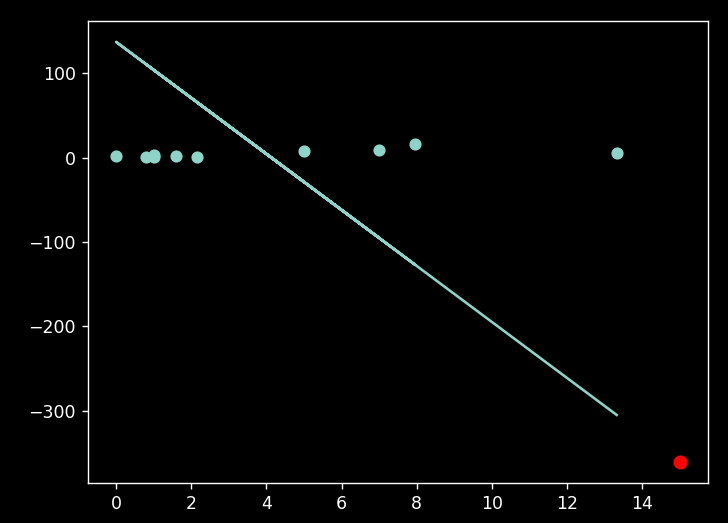
adding predictions:
predict_x = 15
predict_y = (m*predict_x)+b

plt.scatter(X,Y)
plt.plot(X, regression_line)
plt.scatter(predict_x,predict_y, s = 50, color="r")
plt.show()