Dive in Datasets

Exercises on ready-made datasets available in Python libraries such as scikit learn or seaborn are more enjoyable the better we understand the data we are working with. I made some examples with the dataset I have chosen for today’s lesson.

dataset: taxis

import seaborn as sns
import matplotlib.pyplot as plt
import pandas as pd
# Load the "taxis" dataset
taxis = sns.load_dataset('taxis')

# Display basic information about the dataset
print(taxis.info())

# Display summary statistics
print(taxis.describe())
# Check for missing values
print(taxis.isna().sum())

# Replace missing values with zeros
taxis_filled = taxis.fillna(0)

# Verify that there are no more missing values
print(taxis_filled.isna().sum())
# Plot the distribution of fares
plt.figure(figsize=(10, 6))
sns.histplot(taxis_filled['fare'], bins=30, kde=True)
plt.title('Distribution of Taxi Fares')
plt.xlabel('Fare')
plt.ylabel('Frequency')
plt.show()
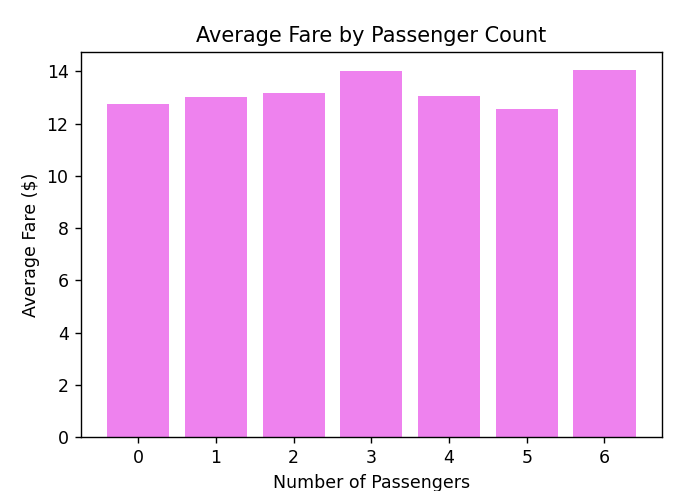
# Calculate the average fare by passenger count
average_fare_by_passenger = 
taxis.groupby('passengers').fare.mean().reset_index()

# Bar plot of average fare by passenger count
plt.figure(figsize=(6, 4))
plt.bar(average_fare_by_passenger['passengers'], 
average_fare_by_passenger['fare'], color='violet')

plt.title('Average Fare by Passenger Count')
plt.xlabel('Number of Passengers')
plt.ylabel('Average Fare ($)')
plt.xticks(average_fare_by_passenger['passengers'])
plt.grid(False)
plt.show()

dataset: diamonds

diamonds = sns.load_dataset('diamonds')

# Display basic information about the dataset
print(diamonds.info())

# Display summary statistics
print(diamonds.describe())

# Display the first few rows of the dataset
print(diamonds.head())

#Display first and last rows as common result
print(pd.concat([diamonds.head(), diamonds.tail()])

# Count the number of rows in the dataset
num_rows = diamonds.shape[0]
print(f"The number of rows in the diamonds dataset is: {num_rows}")

# List the name of headers
for headers in diamonds.columns:
    print(headers)
# Select data from diamonds dataset: 
#5 selected columns and 1000 rows + headers
diamonds_data = diamonds[['carat', 'cut', 'color',
                          'clarity', 'price']].head(1001)

# Show selected data
print(diamonds_data)

# or as dataset with pandas
df_diamonds_data = pd.DataFrame(data=diamonds_data)
print(df_diamonds_data)

ops on diamonds: count, drop column, pivot table

# Count how many Ideal score is in column cut
print(df_diamonds_data['cut'].value_counts()['Ideal'])

# Drop one column in dataset
df_diamonds_data.drop('clarity',
                      axis=1,
                      inplace= True)
print(df_diamonds_data)

# Create pivot table
table = pd.pivot_table(df_diamonds_data,
                       values=['color', 'cut'],
                       index=['carat', 'price'],
                       aggfunc={'carat': "mean",
                                'price': ["min", "max", "mean"]})
print(table)

Scikit-learn, Seaborn and Pandas for Datasets

Would like to find out, what possibilities Python gives us for datasets.
We can use the following libraries for this:
scikit-learn
seaborn
TensorFlow (tfds)
PyTorch (torchvision and torchaudio)
Kaggle API
Today we will discuss the use of the first two with pandas elements, which we already know from previous lessons.

Hello AI, how to get well-known datasets in python? Show me libraries and method of how to get list of datasets form each library.
from sklearn import datasets
import seaborn as sns

# List of datasets
#sklearn
print(dir(datasets))
dt_sklearn = dir(datasets)

for d in dt_sklearn:
    if d.startswith("load"):
        print(d)

#seaborn
print(sns.get_dataset_names())
#or
for elem in sns.get_dataset_names():
    print(elem)

sklearn and pandas

#sklearn and pandas
from sklearn.datasets import load_iris
import pandas as pd

# Load the iris dataset
iris = load_iris()

# Convert to pandas DataFrame
iris_df = pd.DataFrame(data=iris.data, columns=iris.feature_names)
iris_df['species'] = iris.target

print(iris_df.head())
print(iris_df[:20])

# Save the DataFrame to a CSV file
iris_df.to_csv('iris_dataset.csv', index=False)

more sklearn and pandas

import requests
import pandas as pd
import numpy as np
from sklearn import preprocessing, svm
from sklearn.model_selection import (cross_validate,
                                     train_test_split)
from sklearn.linear_model import LinearRegression
import math

#open file to read it content, features, parameters
FilePath = r"C:\Users\Agnieszka\Desktop\Animals.csv"
GetFile = open(FilePath)
DataFile = GetFile.read()
#print(DataFile)
GetFile.close()

import chardet

with open(FilePath, 'rb') as fp:
    result = chardet.detect(fp.read())
    print(result)  # Wyświetli wykryte kodowanie


df = pd.read_csv(FilePath, sep=';', na_values='No data', 
                 encoding='ascii')
df = df.fillna('0.00')
#print(df)

#creating sum colun from 3 others
df = df[['Moose', 'Boars','Deer','Dama','Fawn']]
df['DeerFamily'] = df['Deer']+df['Fawn']+df['Dama']
df = df[['Moose','Boars','DeerFamily']]
#print(df)

forecast_col = 'DeerFamily'
forecast_out = int(math.ceil(0.1*len(df)))
df['label'] = df[forecast_col].shift(-forecast_out)
#print(df)
df = df.fillna('0.00')
print(df.head(2))
print(df.tail(3))

#regression
X = np.array(df.drop(['label'], axis=1))
print(X[:3])
y = np.array(df['label'])
X = preprocessing.scale(X)
#y = np.array(df('label'))

X_train, X_test, y_train, y_test = (
    train_test_split(X,y,test_size=0.2))

clf = LinearRegression()
clf.fit(X_train, y_train)
accuracy = clf.score(X_test, y_test)

print(accuracy)
#output: -1.1791136212815982

seaborn

# seaborn
import seaborn as sns
import pandas as pd

# load the dataset
planets_df = sns.load_dataset('planets')
print(planets_df.columns)
print(planets_df.describe())

# Update data in dataframe
planets_df.fillna(0, inplace=True)

print("\n DataFrame Planets column Mass as example \
    after in-place replacement of NaN with zeros:")
print(planets_df['mass'])

Mass_Column = planets_df['mass']
Mass_Column100 = Mass_Column[:100]
print(Mass_Column100)
Mass_List = Mass_Column100.tolist()
print(Mass_List)

# Save column after changes to csv, first 100 rows
Mass_List.to_csv('planets.csv', index=False)

more seaborn

from sklearn import datasets
import seaborn as sns

exercise_df = sns.load_dataset('exercise')
print(exercise_df.head())
print(exercise_df.tail())
print(exercise_df['kind'].drop_duplicates())
''' output:
0        rest
30    walking
60    running
Name: kind, dtype: category
Categories (3, object): ['rest', 'walking', 'running']'''

column = 'pulse'

# Znajdź maksymalną i minimalną wartość
max_value = exercise_df[column].max()
min_value = exercise_df[column].min()

print(f"Max value in column '{column}' is: {max_value}")
print(f"Min value in column '{column}' is: {min_value}")

print(exercise_df['diet'].value_counts())
sorted_data = exercise_df.sort_values(by='time',
                                      ascending=False)
print(sorted_data)

exercise_df['pulse_category'] = (
    exercise_df['pulse'].apply(lambda x:
                               'High' if x > 100 else 'Low'))
print(exercise_df[['pulse', 'pulse_category']])

aggregated = exercise_df.agg({
    'pulse': ['mean', 'max', 'min'],
    'time': ['nunique']
})
print(aggregated)