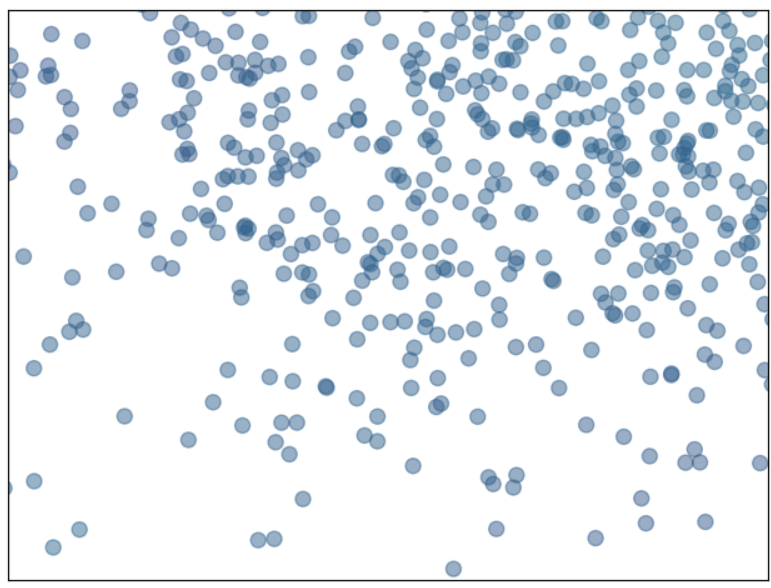
Scatter plot
#Scatter plot
import numpy as np
import matplotlib.pyplot as plt

n = 1500
#X = np.random.normal(0, 1, n)
X = np.random.gumbel(1,2,n)
Y = np.random.normal(1, 1, n)
T = X*Y

plt.axes([0.025, 0.025, 0.95, 0.95])
plt.scatter(X, Y, s=75, c=T, alpha=0.5)
plt.xlim(-1.5, 1.5)
plt.xticks(())
plt.ylim(-1.5, 1.5)
plt.yticks(())
plt.show()
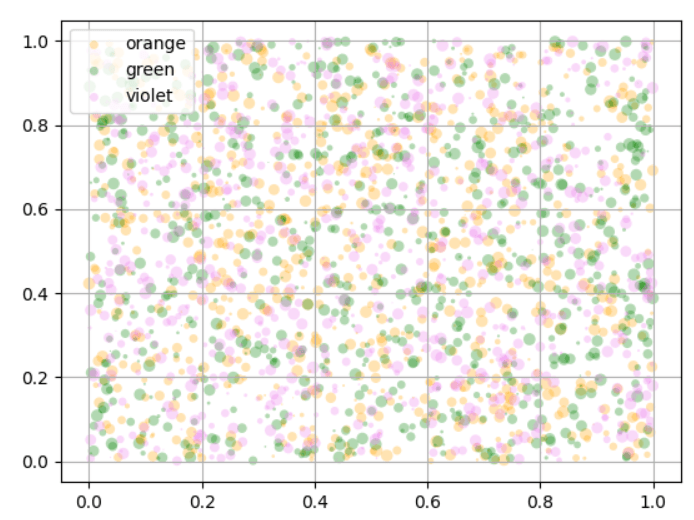
with legend
from numpy.random import rand

fig, ax = plt.subplots()
for colors in ['orange', 'green', 'violet']:
    n = 750
    x, y = rand(2, n)
    scale = 50.0 * rand(n)
    ax.scatter(x, y, c=colors, s=scale, label=colors,
               alpha=0.3, edgecolors='none')

ax.legend()
ax.grid(True)
plt.show()
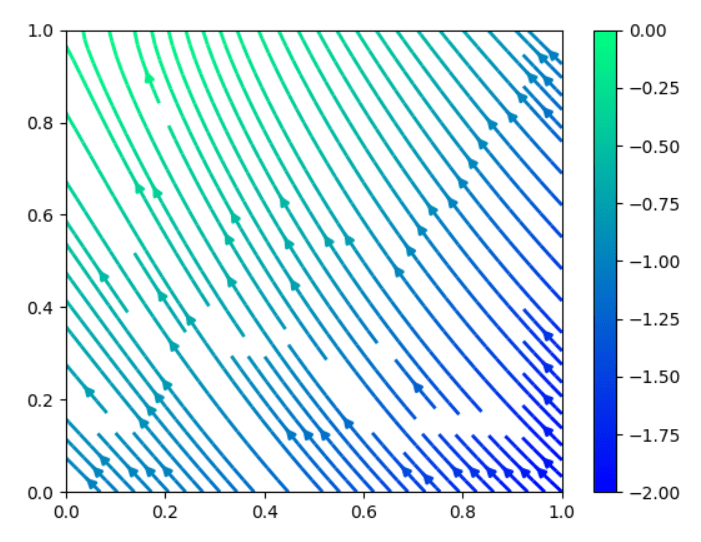
Streamplot in winter shades
Y, X = np.mgrid[0:1:50j, 0:1:50j]
x = -1 - X**2 + Y
y = 1 + X - Y**2
speed = np.sqrt(x**2 + y**2)

fig, ax = plt.subplots()
strm = ax.streamplot(X, Y, x, y, color=x, linewidth=2,
                     cmap=plt.cm.winter)
fig.colorbar(strm.lines)

plt.show()