Well, this is my last post in this year.
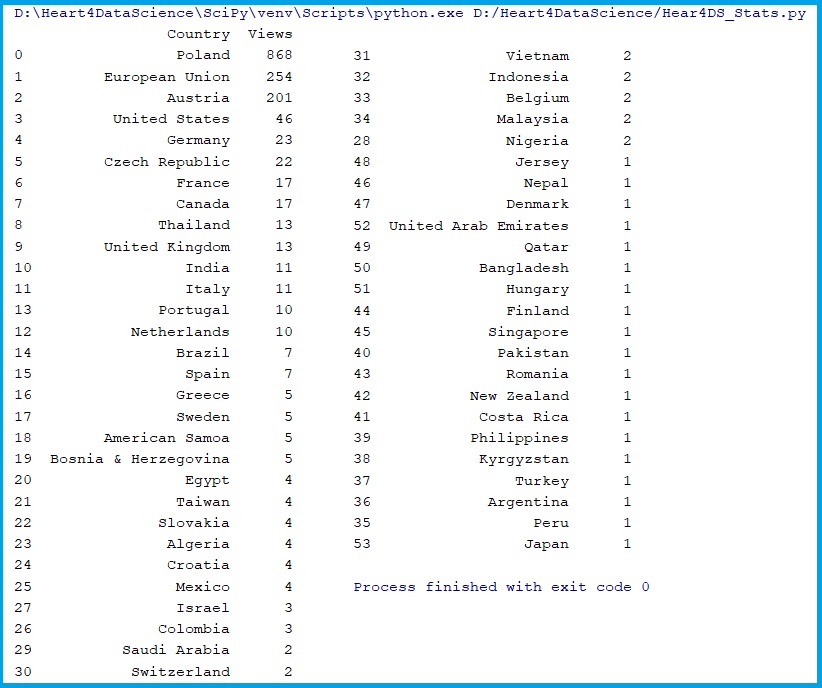
I’ve just downloaded my stats from WordPress to get information about how many people form which Country visit my side in 2020.
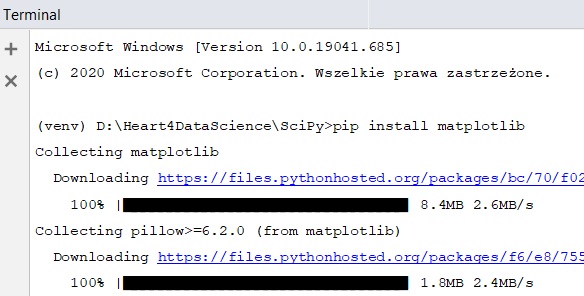
Wit matplotlib in Python I can present some data on the diagrams. First, need to install lib in PyCharm: pip install matplotlib.
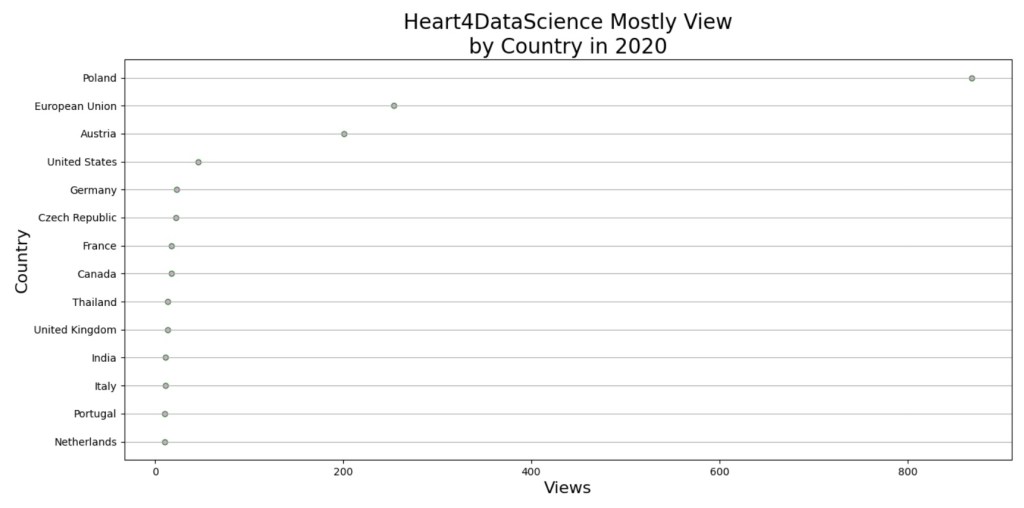
Then try to read data from file and present the visalisation.
df = pd.read_csv('sunsetgirlsql_countryviews_12312020.csv', sep=',')
df = df.sort_values('Views', ascending=False)
print(df)
#Visualisation
# Filtering Views Value:between 10 to 1000.
df = df[(df['Views'] >= 10) & (df['Views'] <= 1000)]
# X-axis:
x = df['Views']
# Y-axis:
y = df['Country']
# Size of the figure (in inches).
plt.figure(figsize=(20,7))

#Scatter
plt.scatter(x, y,s = 100, color = 'violet',
            alpha = 0.8, marker = '.',
            edgecolors='green')
# X-axis label.
plt.xlabel('Views', fontsize = 16)
# Y-axis label.
plt.ylabel('Country', fontsize = 16)

# Title of the plot.
plt.title('Heart4DataScience Mostly View\nby Country in 2020',
          fontsize = 20)
# Grid
plt.grid(axis='y')

# Displays the plot.
plt.show()
# Clears the current figure contents.
plt.clf()
Wave goodbye to the old and embrace the new full of hope, dream, and ambition. Wishing you a happy new year full of happiness!
